

"How do we know it's working?" is the most important question anyone can ask about a STEM programme. Head teachers need the answer to justify timetable space. Parents want to know their children are learning. Donors and CSR teams need evidence to report to their boards.
This guide sets out a practical monitoring and evaluation (M&E) framework for school STEM programmes. It's the same logic we use at Ideotronix, and it's simple enough for a single school to adopt.
Outputs, outcomes and impact: know the difference
- Outputs are what the programme delivers: sessions held, students enrolled, kits in use. They show activity, not change.
- Outcomes are the changes in people: skills gained, confidence built, teachers able to lead sessions.
- Impact is the long-term change: students choosing STEM pathways, solving real problems, entering technical careers.
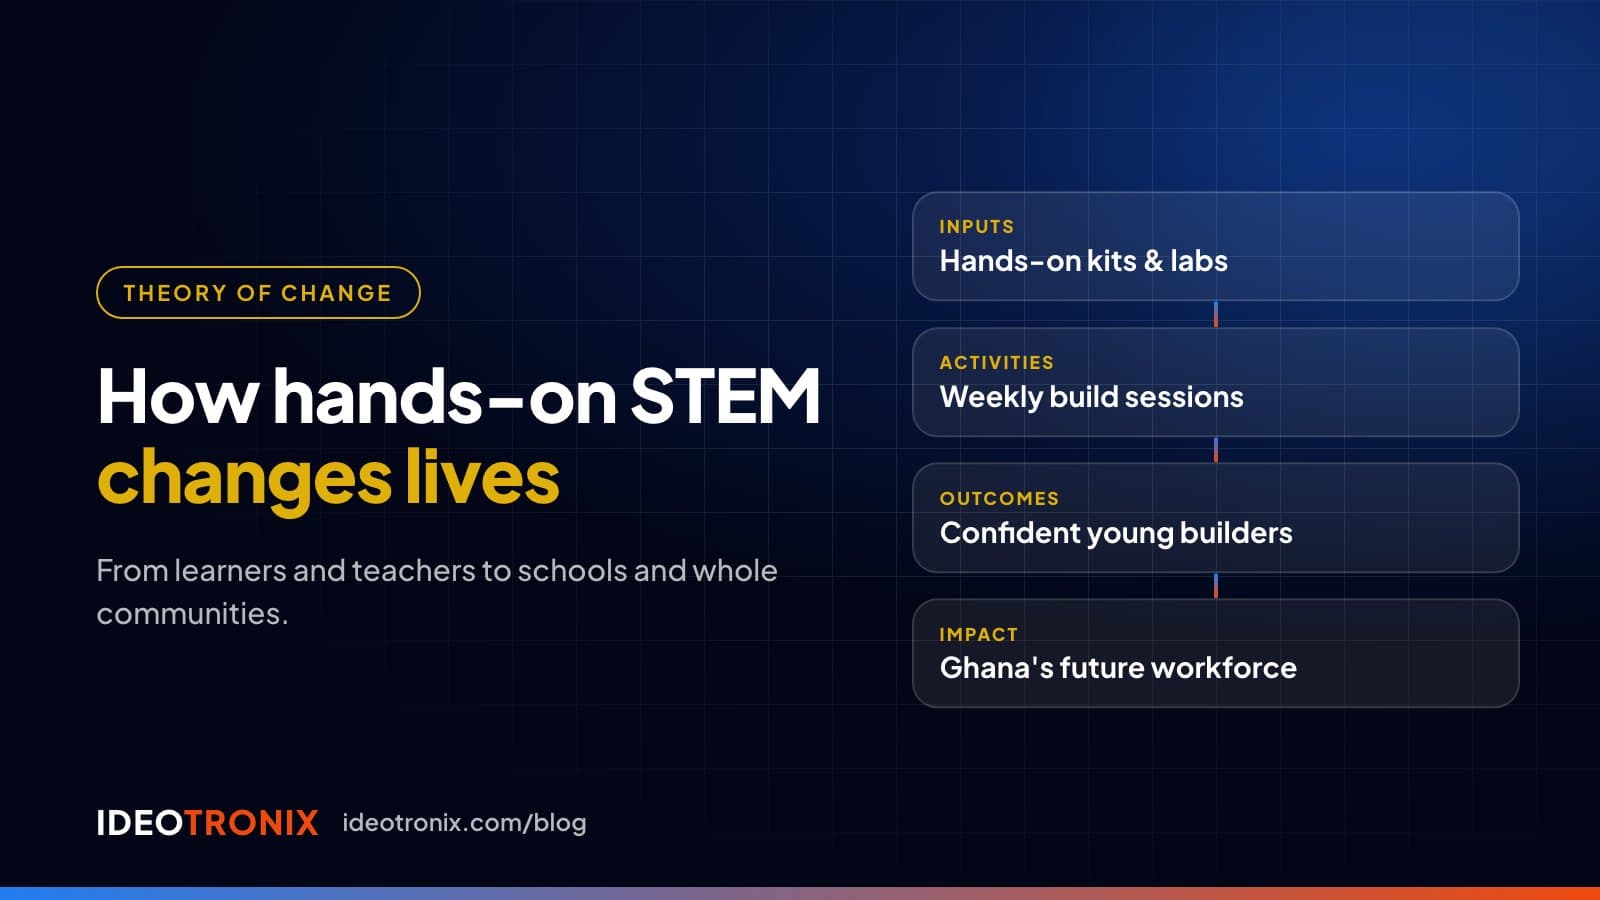
Many programmes only report outputs ("we reached 500 students"). Strong programmes report outcomes too, and track early signs of impact. This mirrors the chain in our theory of change.
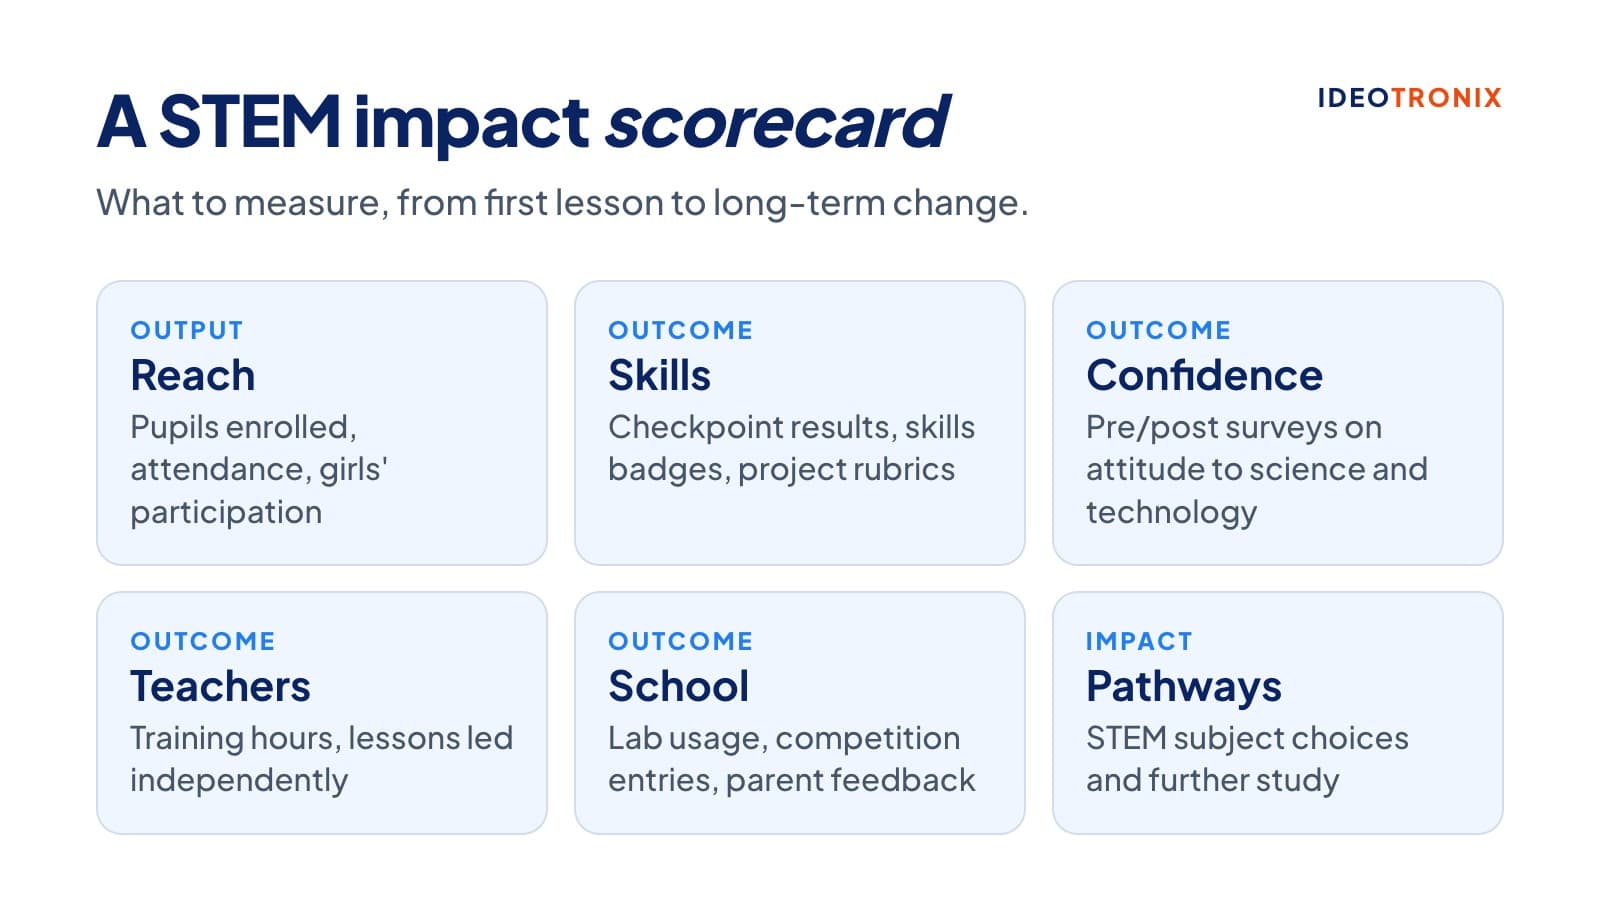
A STEM impact scorecard
| Area | Example indicators | How to collect |
|---|---|---|
| Reach | Students enrolled, attendance rate, share of girls participating | Class registers |
| Skills | Checkpoint pass rates, skills badges earned, project rubric scores | Graded checkpoints and rubrics |
| Confidence and attitude | Change in students' confidence with technology and interest in STEM careers | Short surveys at the start and end of the year |
| Teachers | Training hours completed, sessions led without outside help | Training logs and lesson observations |
| School | Weekly lab usage, competition entries, parent feedback | Lab timetable, competition records, parent surveys |
| Pathways | STEM subject choices, further study, internships | Follow-up with graduating students |
Start with a baseline
You can only show change if you know where you started. Before the programme begins, record a baseline: a short survey of students' confidence and interest, a simple practical task, and the teachers' current comfort with the equipment. Repeat the same measures at the end of each term.
Simple data collection tools
- Checkpoint rubrics: score each project on function, design, code quality, teamwork and presentation.
- Pre and post surveys: five to ten questions, the same each time, on a 1 to 5 scale.
- Project portfolios: photos, code and short reflections that show growth over time.
- Lesson observations: a one-page checklist for observing teachers leading sessions.
- Stories: short case studies of individual students. Funders value numbers and stories together.
Measure inclusion, not just totals
Break every indicator down by gender and, where possible, by class and school type. A programme can grow overall while girls quietly drop out. Tracking this early lets you act. We share practical approaches in girls in STEM in Ghana.
Reporting to boards, donors and partners
- Lead with outcomes, then support them with outputs.
- Show change over time against your baseline.
- Add two or three student stories with photos of their projects.
- Be honest about challenges and what you will change. It builds trust.
- Keep a consistent format each term so readers can compare.
For organisations funding programmes, we agree indicators at the start and report against them through the year. See how a partnership with Ideotronix works.
Frequently asked questions
How do you measure the impact of a STEM programme?
Set a baseline, then track indicators across reach (enrolment and attendance), skills (checkpoint and project scores), confidence (pre and post surveys), teachers (training and sessions led), school outcomes (lab usage and competitions) and pathways (STEM subject choices and further study).
What is the difference between outputs and outcomes?
Outputs are what a programme delivers, such as sessions held or students enrolled. Outcomes are the changes in people, such as skills gained or confidence built.
How often should a school report STEM programme results?
Once per term works well for most schools and funders, using the same format each time so progress can be compared.